Explore the 4 dashboard pages with real system screenshots. Use the
button at the top to switch between Dark and Light modes!
Light Mode
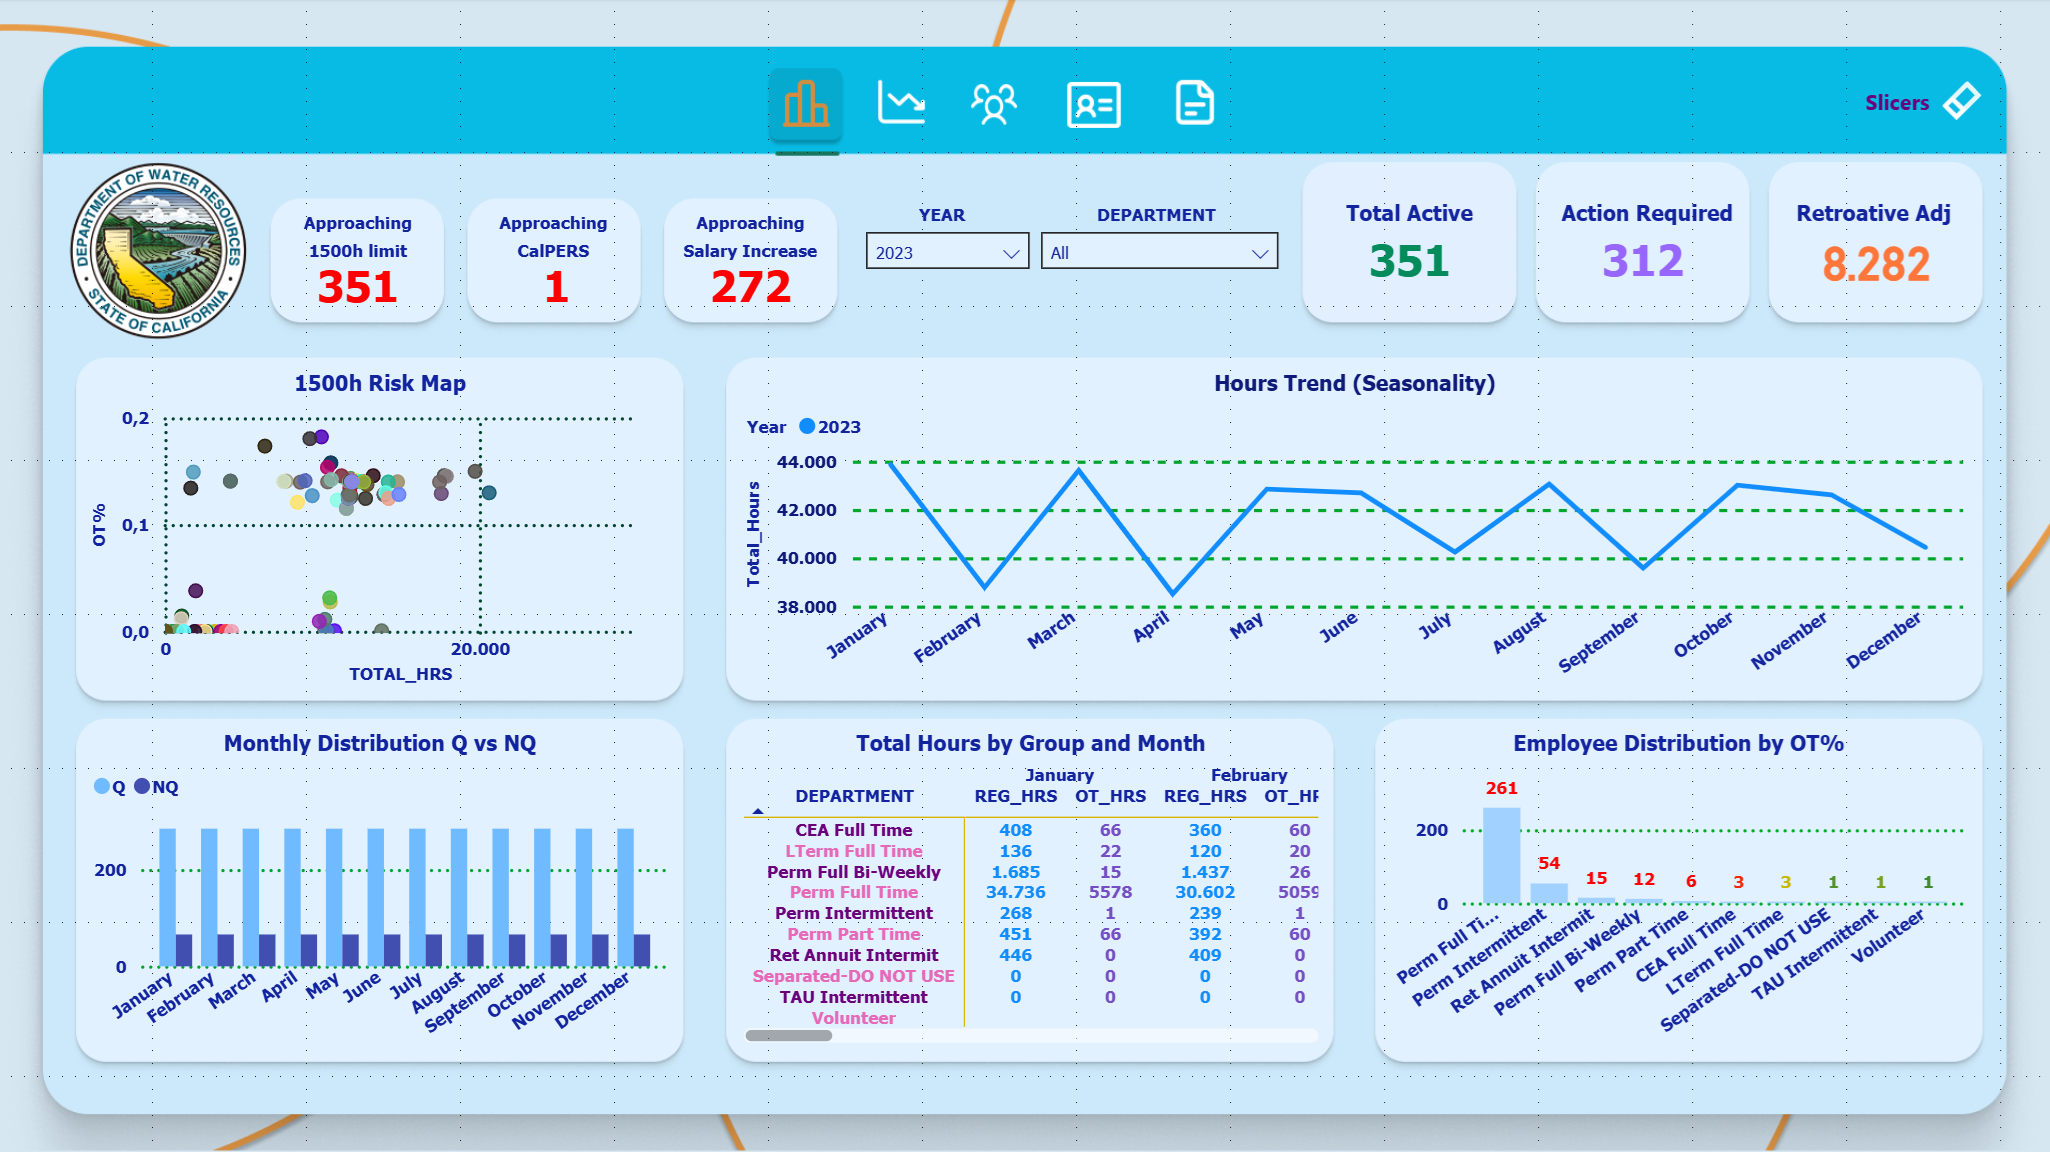
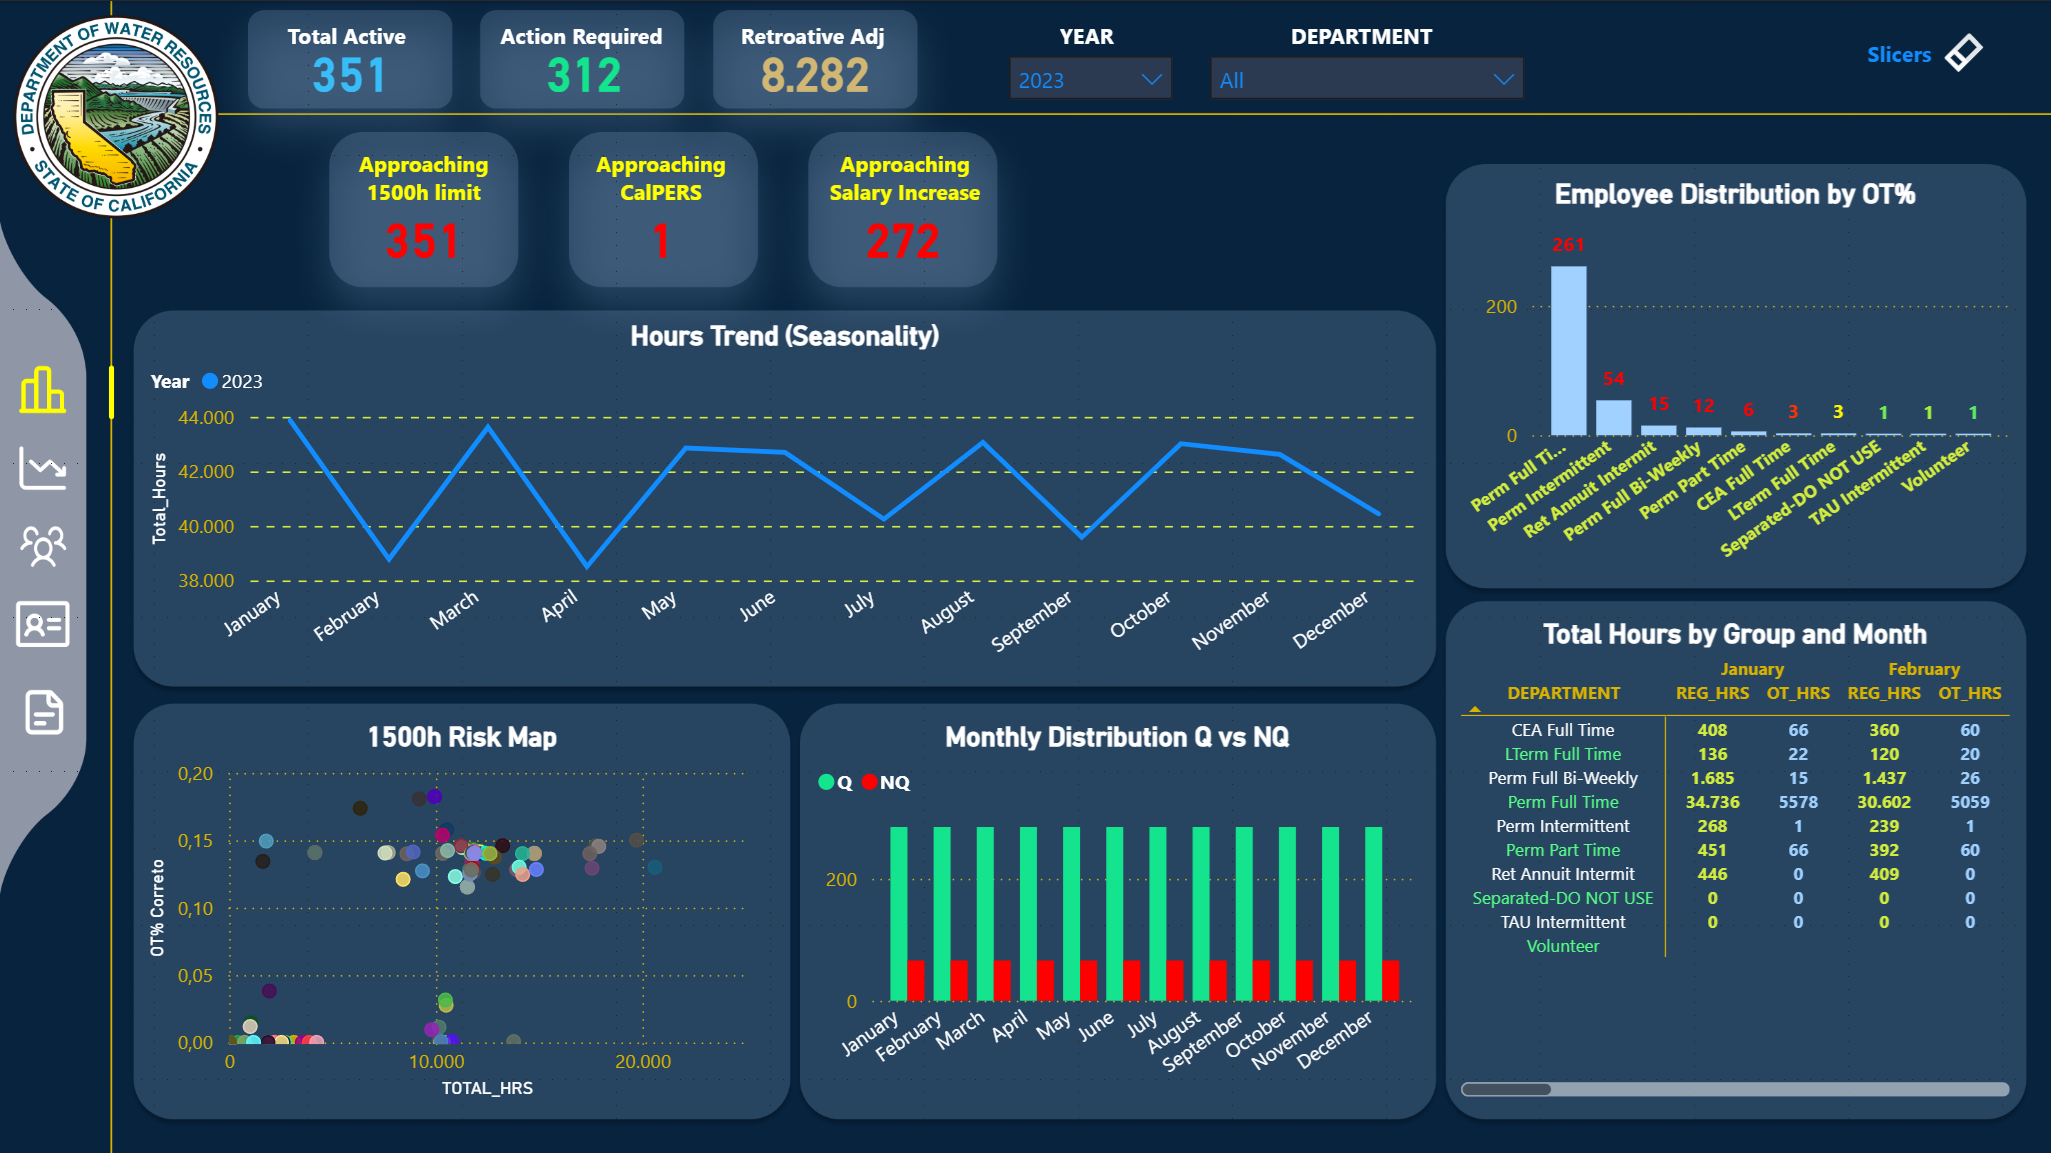
📊 Overview - General View
Main page with consolidated view of all indicators and trends.
Overview Page
📈 Indicator Cards
Total Active
Total active employees in the selected period
Main Metric
Action Required
Employees requiring immediate action (approaching limits)
Alert
Retroactive Adjustments
Total retroactive adjustments required
Financial
Approaching 1500h Limit
Employees approaching the 1500 annual hours limit
Risk
Approaching CalPERS
Employees approaching CalPERS eligibility (1000h)
Benefit
Approaching Salary Increase
Employees approaching salary increase (SISA/MSA)
Compensation
📊 Charts and Visualizations
1500h Risk Map
Type: Scatter Plot
X-Axis: Total Hours
Y-Axis: Overtime Percentage (OT%)
Purpose: Identify employees at risk of exceeding 1500h with high
overtime
Hours Trend (Seasonality)
Type: Line Chart
Period: Monthly (Jan-Dec)
Series: Multiple years (2006-2023)
Purpose: Analyze seasonality and trends in hours worked
Monthly Distribution Q vs NQ
Type: Bar Chart
Categories: Qualified (Q) and Non-Qualified (NQ)
Purpose: Compare monthly distribution between qualified and non-qualified
employees
Total Hours by Group and Month
Type: Matrix Table
Rows: Departments
Columns: Months (Jan, Feb)
Values: REG_HRS, OT_HRS
Employee Distribution by OT%
Type: Horizontal Bar Chart
Categories: OT% Ranges (0-10%, 10-20%, etc.)
Purpose: Visualize employee distribution by overtime percentage
🎛️ Available Filters
- YEAR: Year selection - Supports multiple selection
- DEPARTMENT: Filter by department
- Auto Filter: When no year is selected, shows only the last year
(2023)
⚠️ Risk Panel - Risk Dashboard
Page dedicated to monitoring employees at compliance risk.
Risk Panel Page
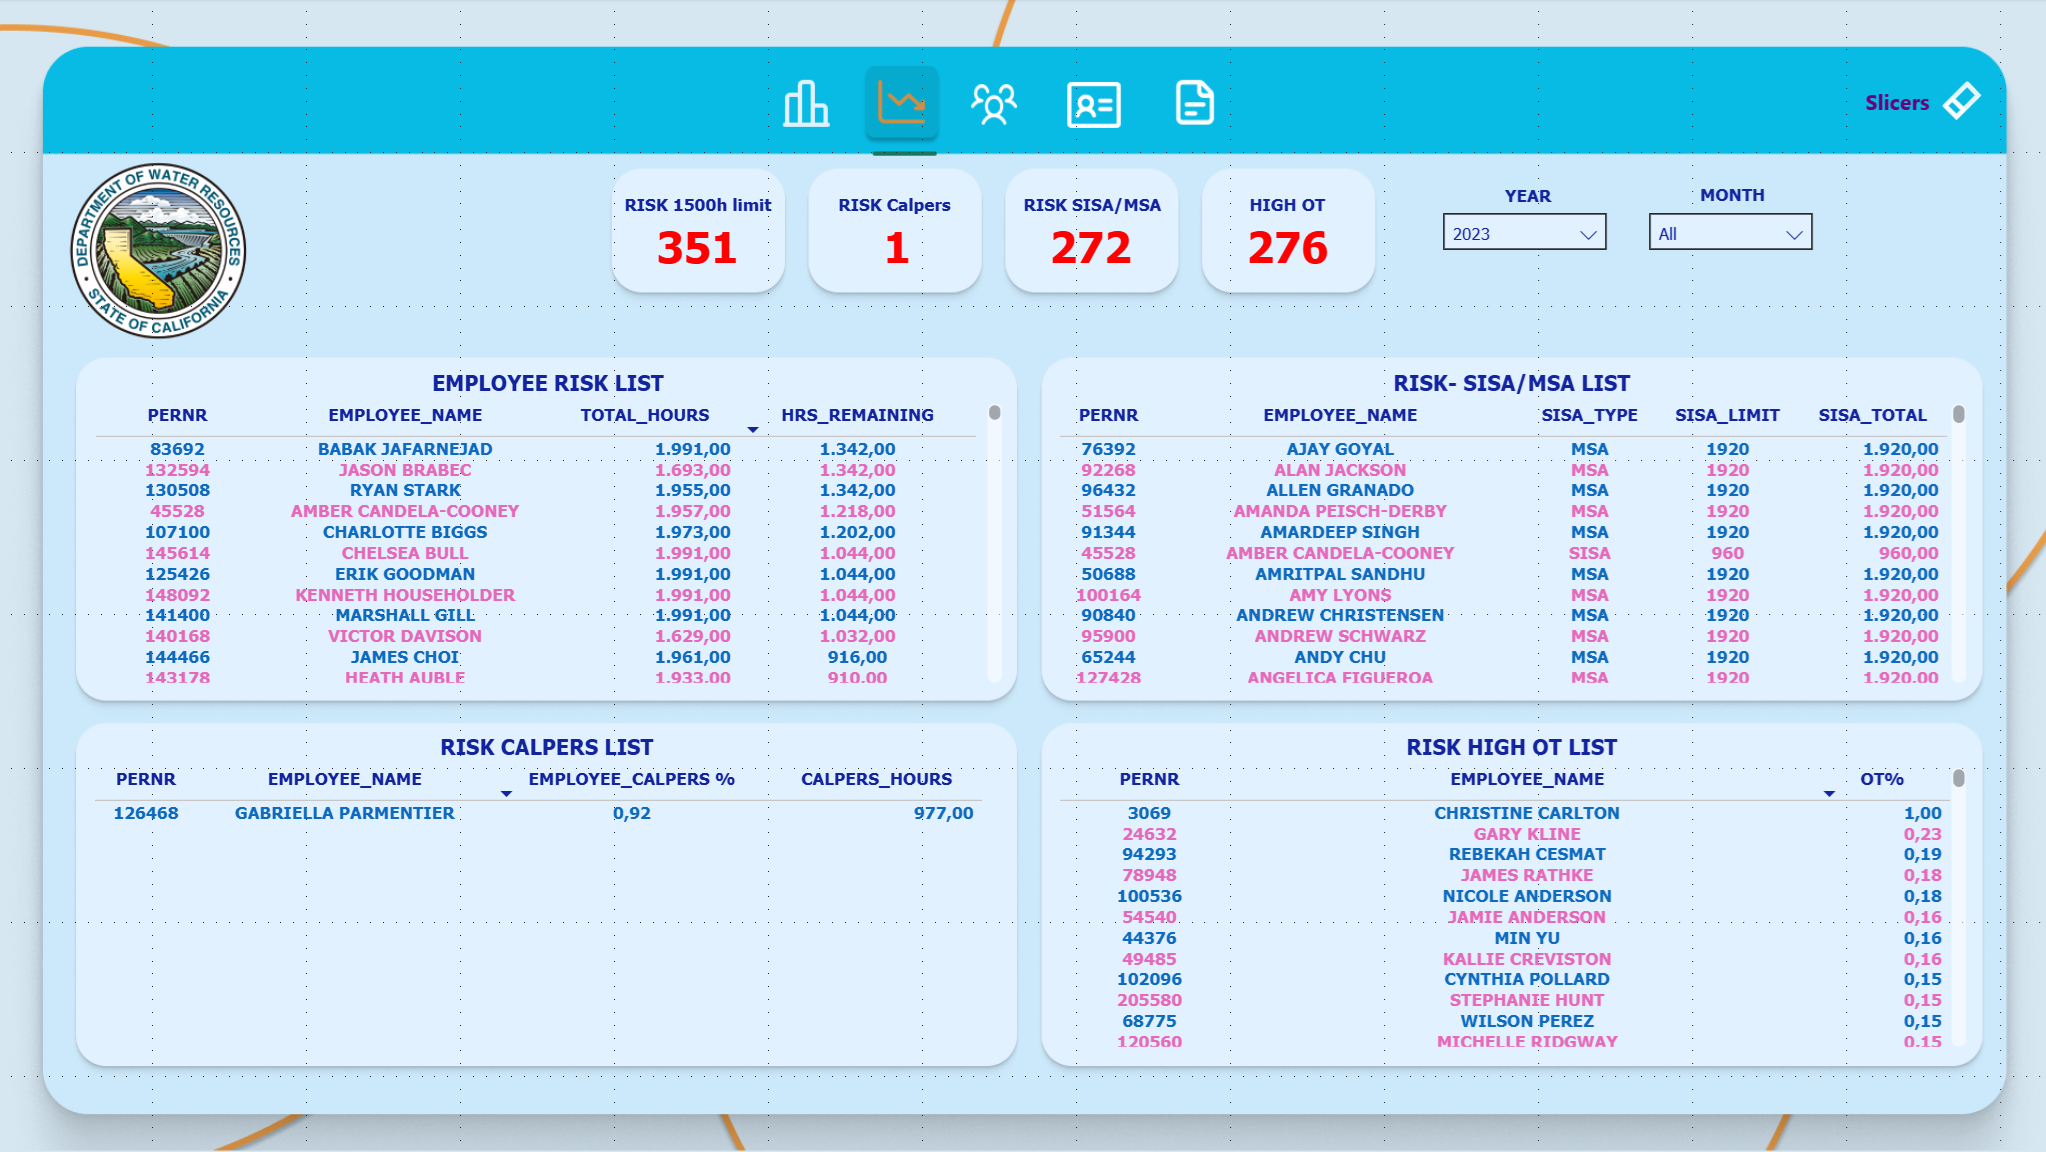
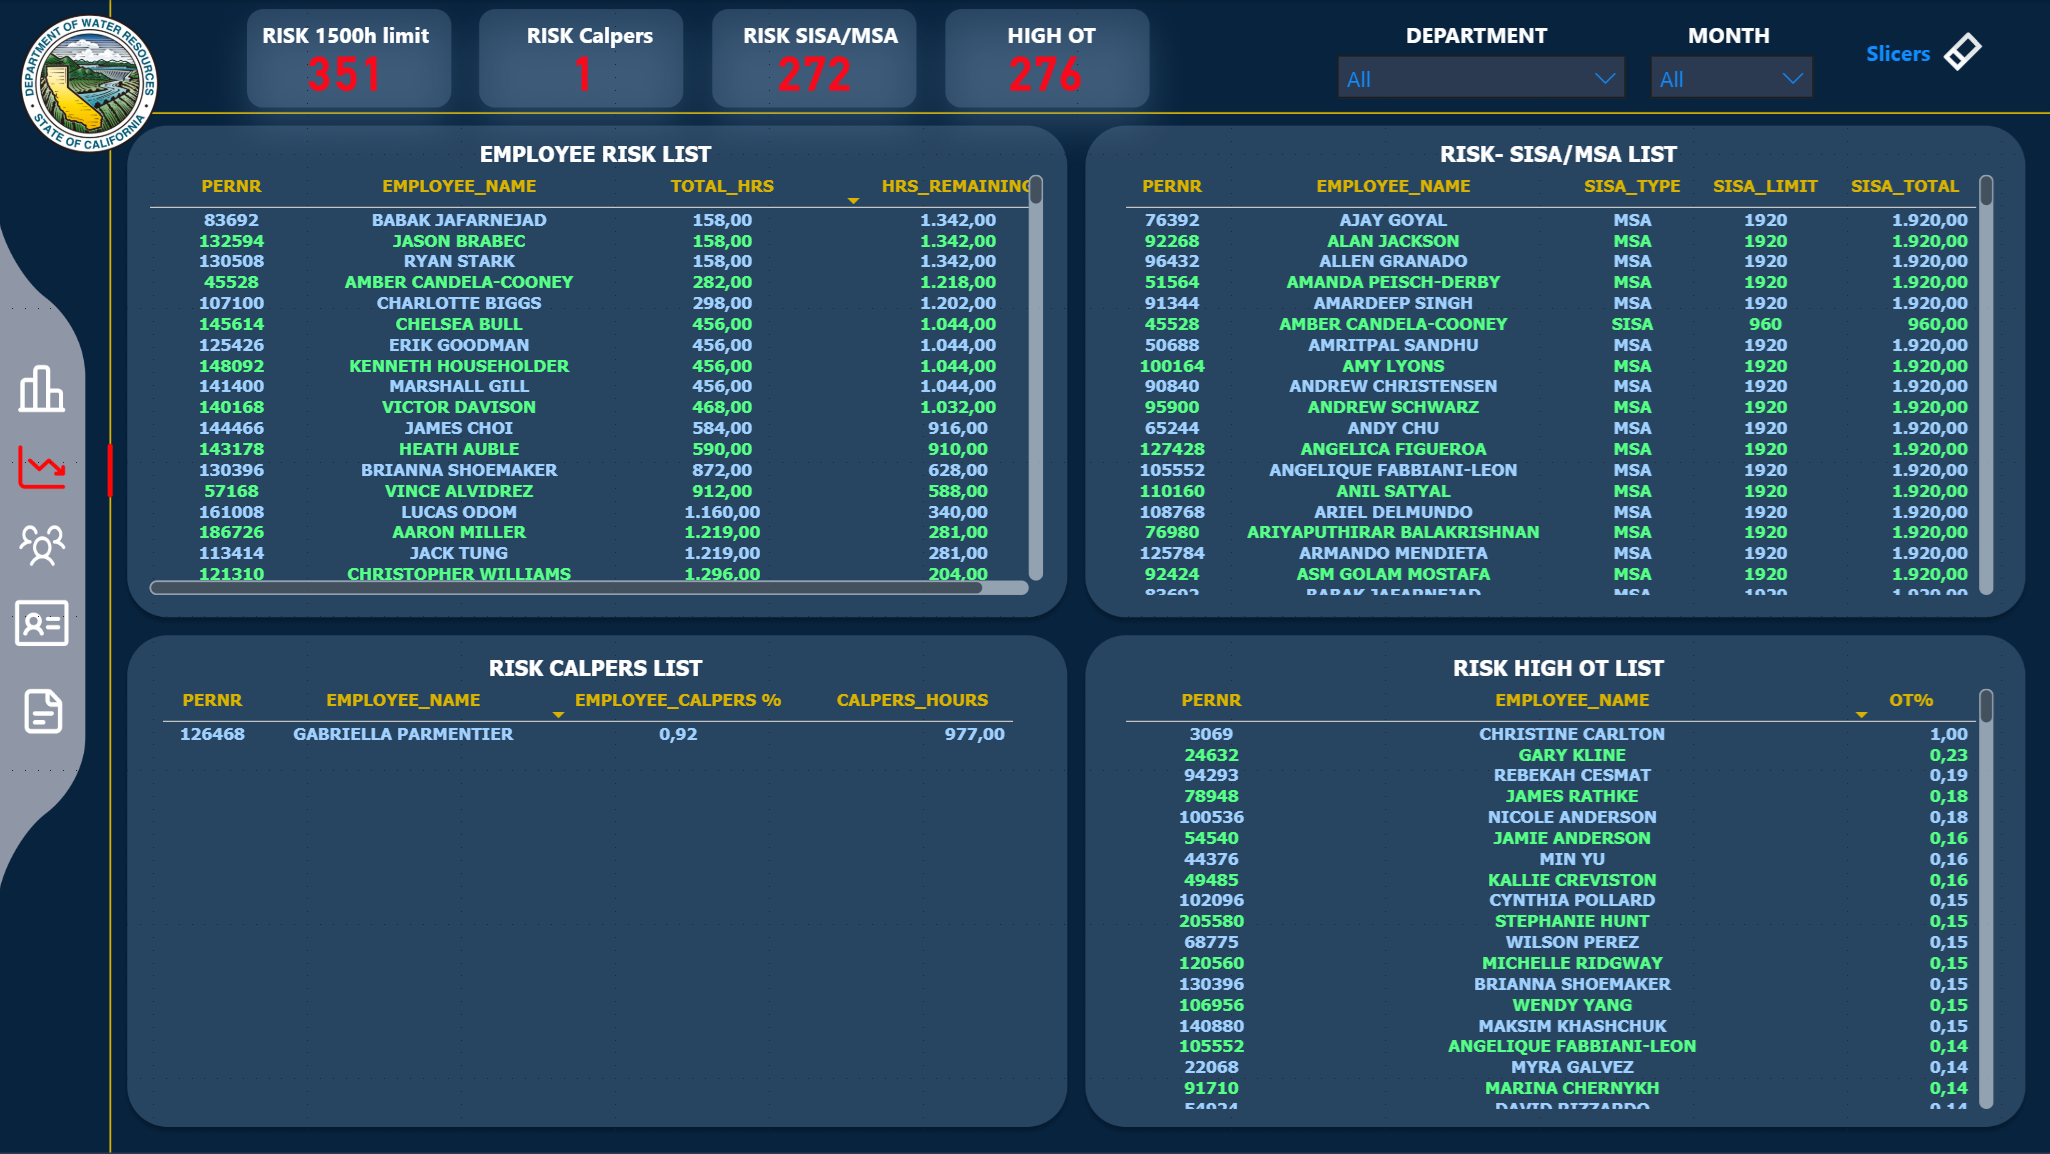
📊 Risk Tables
EMPLOYEE RISK LIST
Criteria: Employees approaching the 1500h limit
Threshold: ≥ 1400h (93% of limit)
Columns: ID, Name, Group, Total Hours, Status
High Risk
RISK SISA/MSA LIST
Criteria: Employees approaching SISA/MSA limits
SISA: ≥ 800h (83% of 960h)
MSA: ≥ 1700h (88% of 1920h)
Attention
RISK CALPERS LIST
Criteria: Employees approaching CalPERS eligibility
Threshold: ≥ 800h (80% of 1000h)
Status: NON-MEMBER only
Benefit
🎯 Risk Indicators
- Risk 1500h Count: Total employees at risk of exceeding 1500h
- Risk SISA Count: Total employees approaching SISA/MSA limits
- Approaching CalPERS: Total employees approaching eligibility
- High OT% Count: Employees with overtime > 40%
👥 Employee List - Employee Roster
Complete table with all employees and their main indicators.
Employee List Page
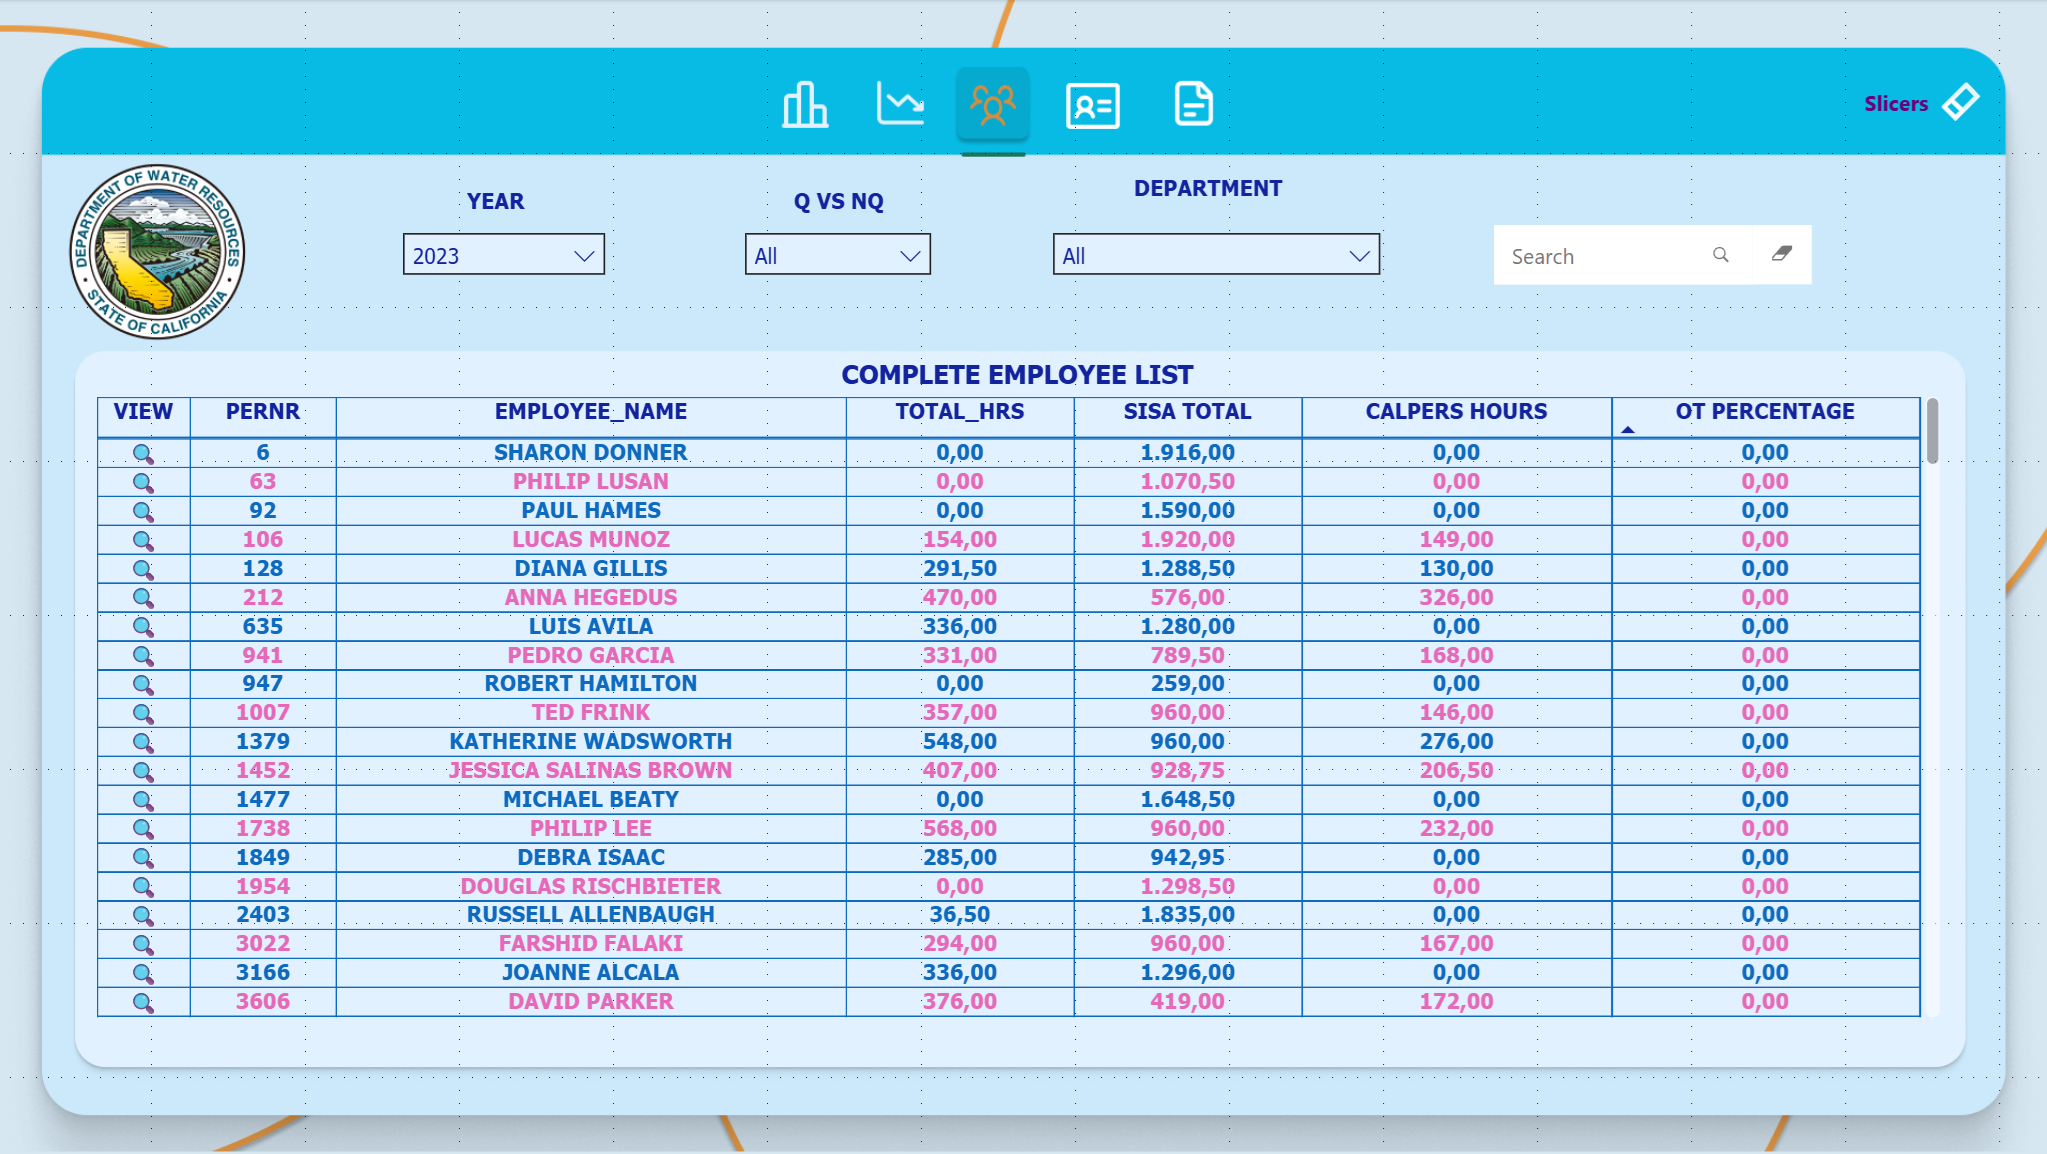
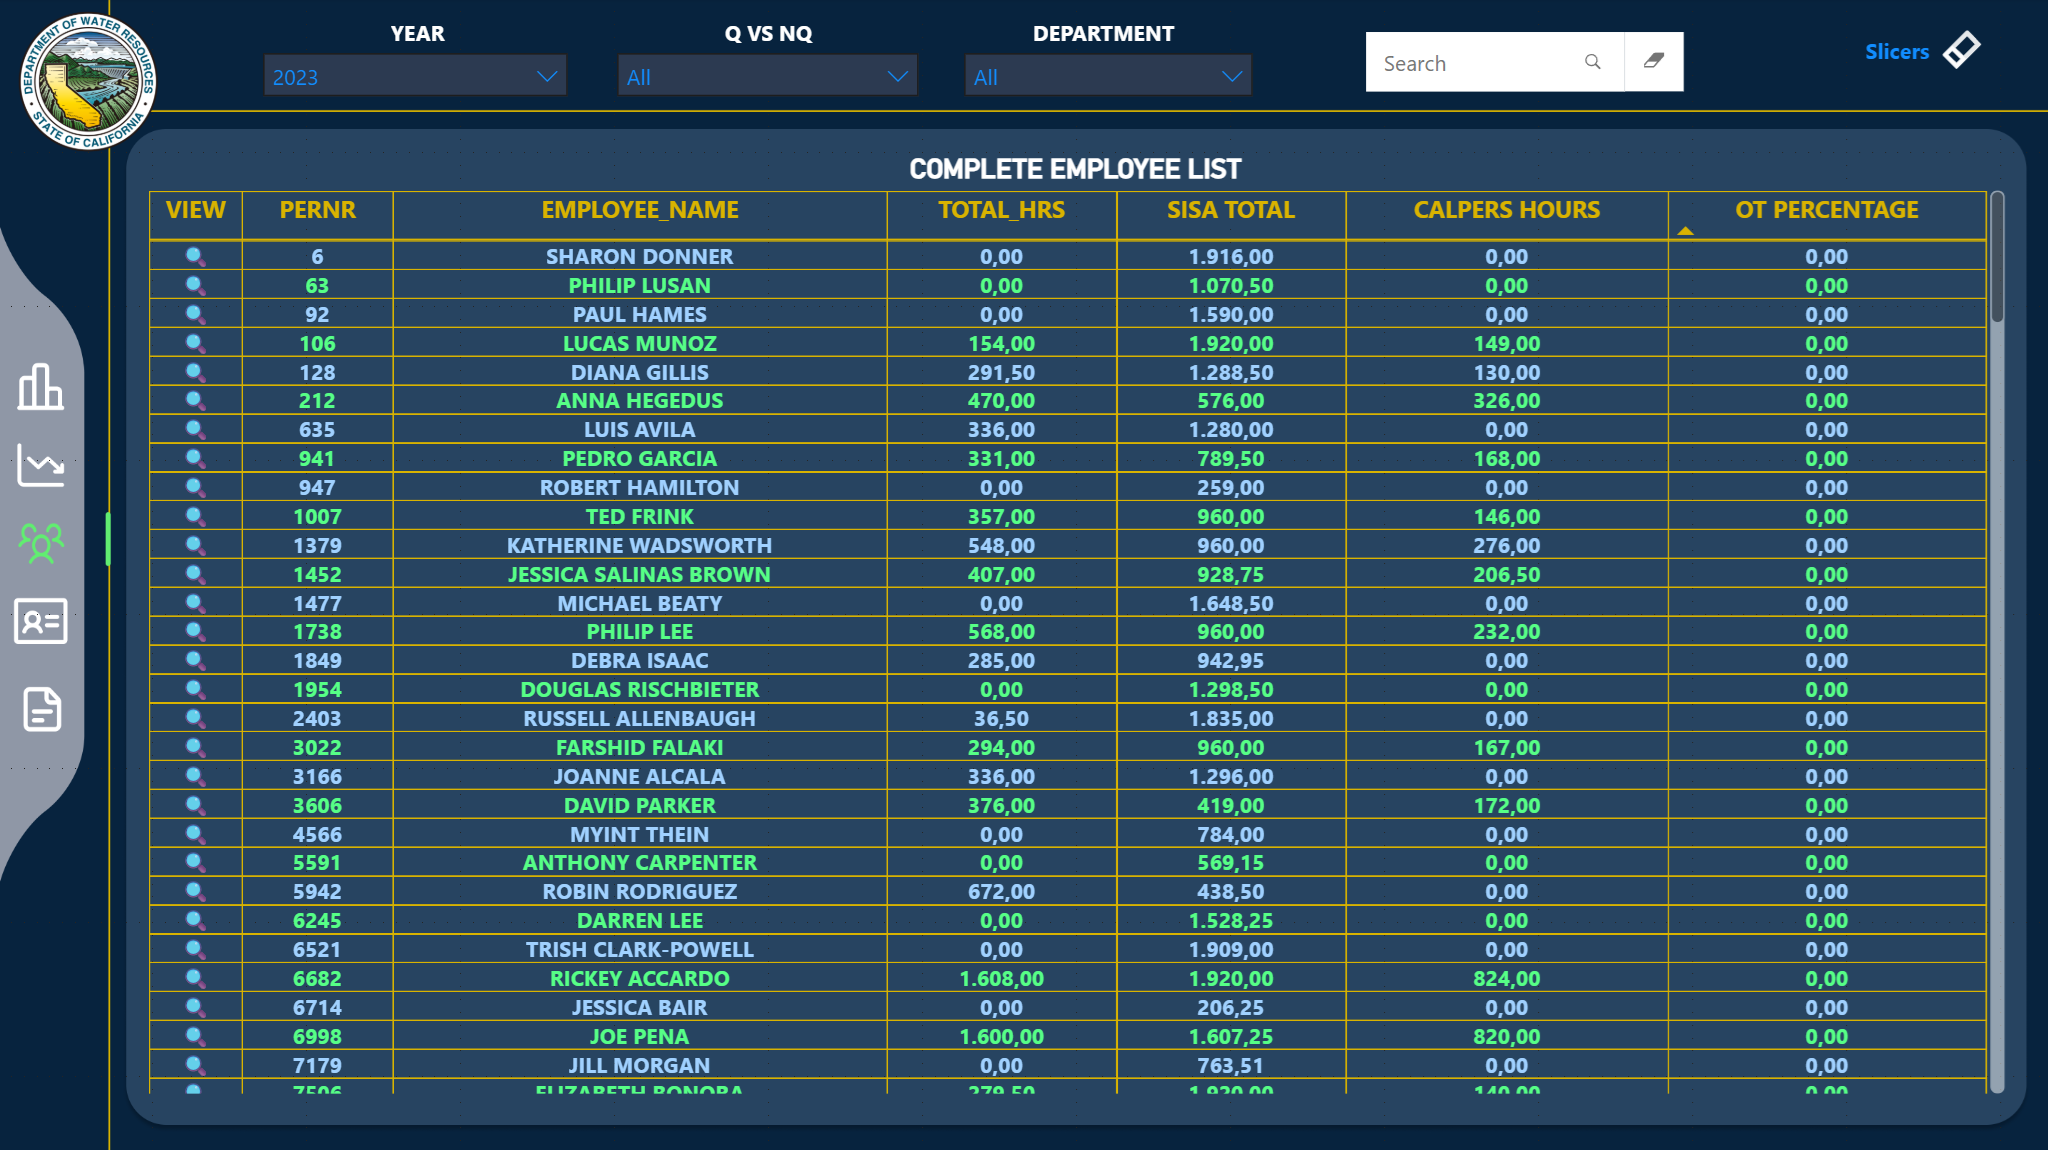
📋 Table Columns
Basic Information
- • ID (PERNR)
- • Employee Name
- • Group/Department
- • Status (MEMBER/NON-MEMBER)
Hours Metrics
- • Total Hours (YTD)
- • Regular Hours
- • Overtime Hours
- • OT Percentage
Compliance Indicators
- • 1500h Progress (%)
- • CalPERS Hours
- • SISA/MSA Progress (%)
- • Health Insurance Status
Alerts and Actions
- • Action Required (Yes/No)
- • Risk Level
- • Qualification Status
- • Retroactive Adjustments
🔍 Features
- Sorting: All columns are sortable
- Search: Search field to filter by name or ID
- Drill-through: Click on an employee to go to Employee Detail
- Export: Ability to export data to Excel
👤 Employee Detail - Employee Details
Detailed analysis page for a specific employee with all indicators and history.
Employee Detail Page
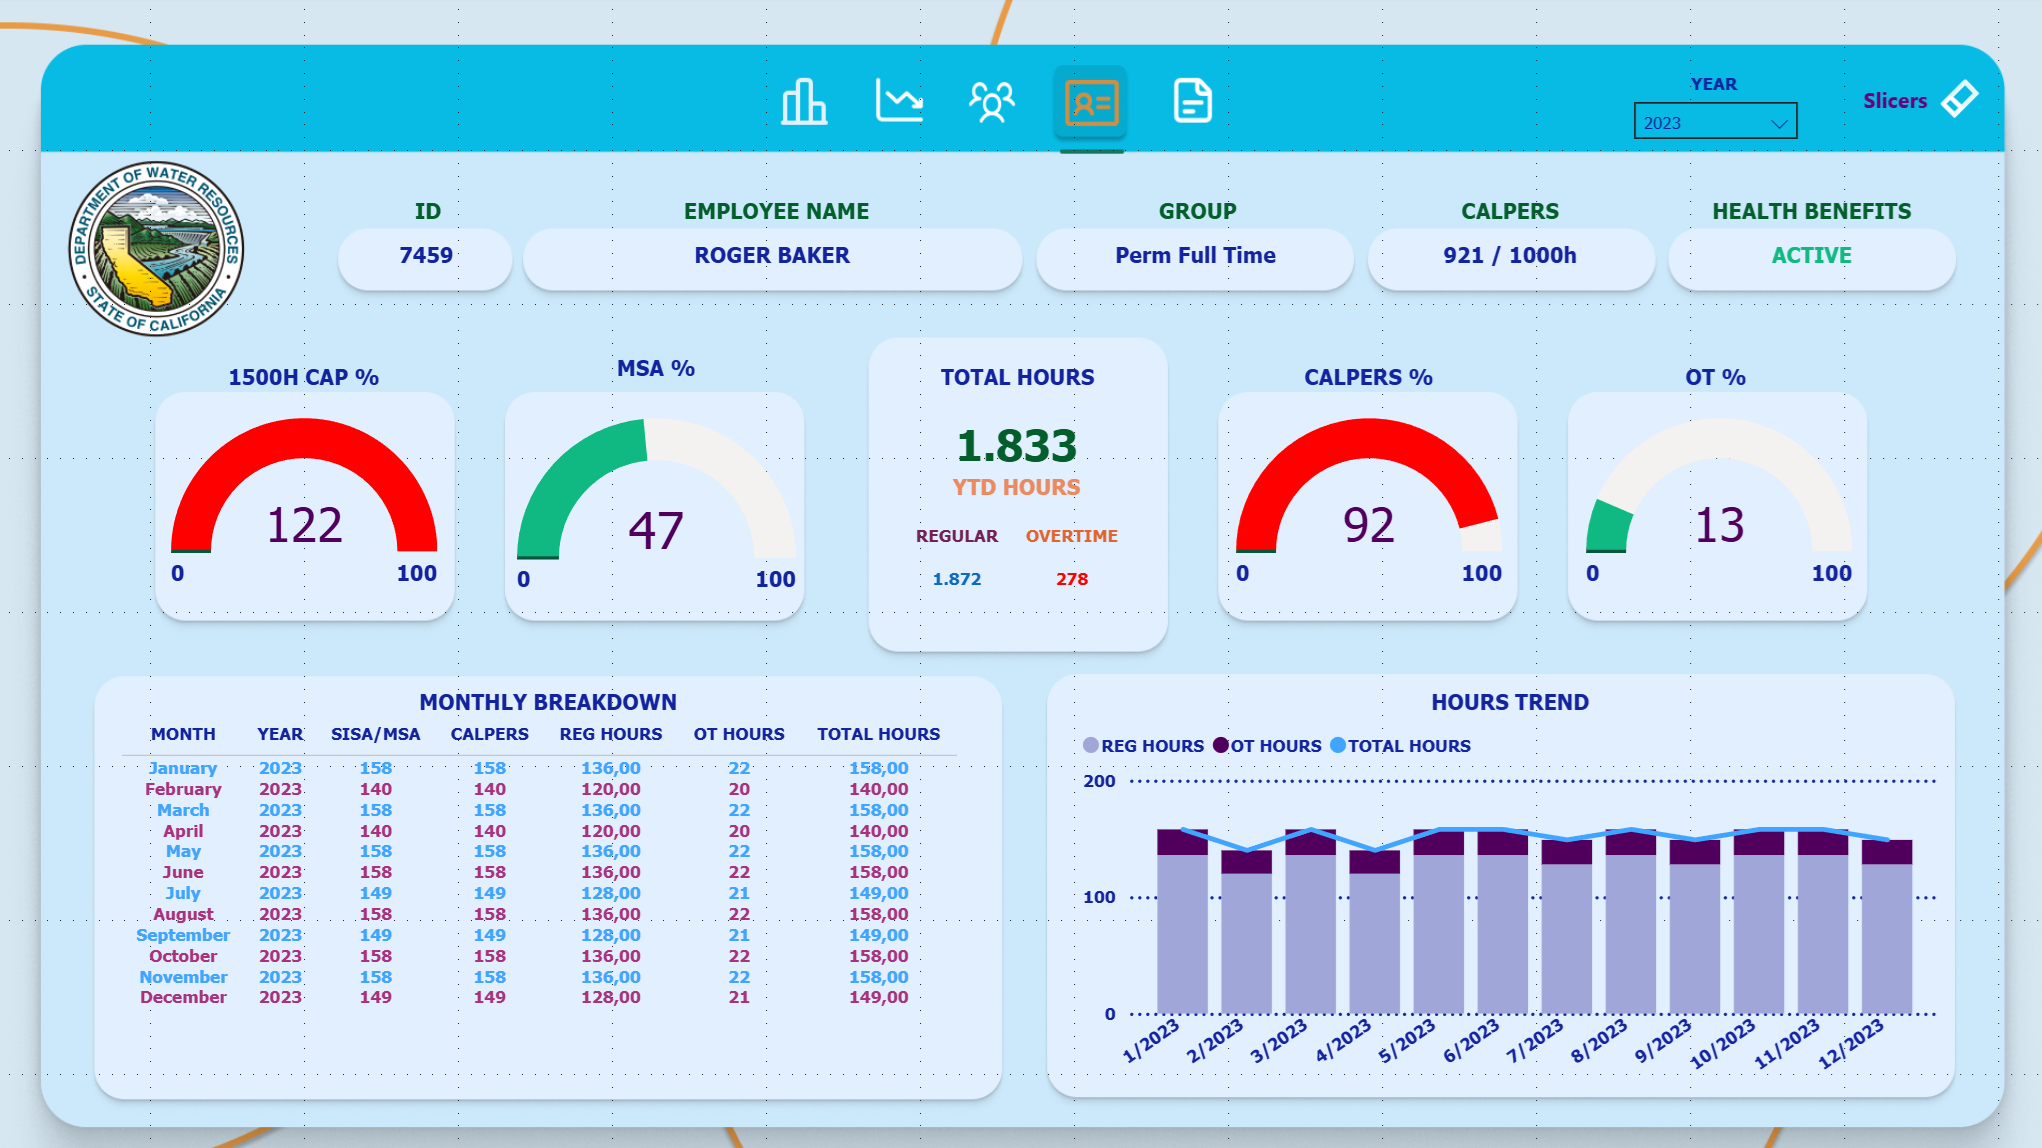
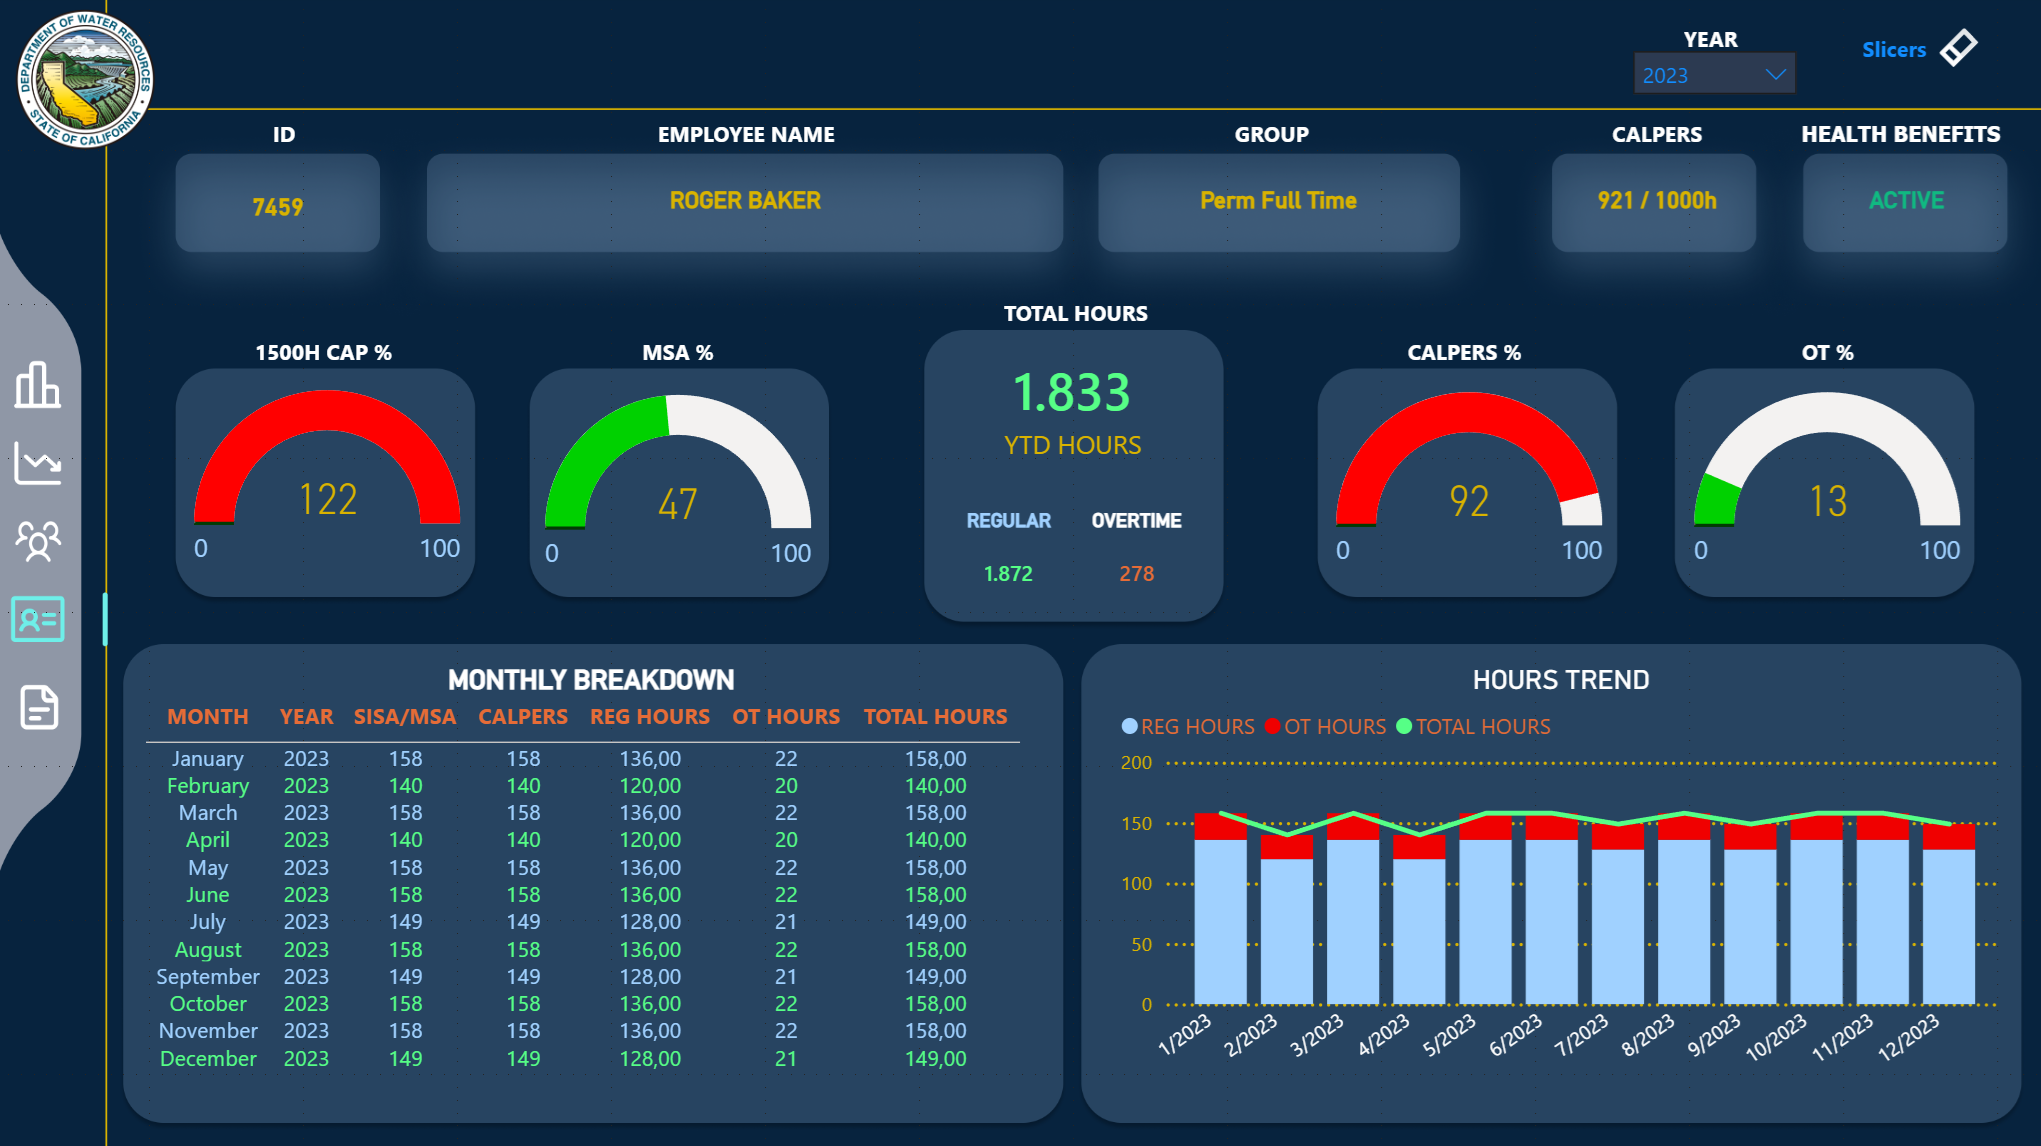
📊 Monitoring Gauges
1500H CAP %
Formula: (Total Hours ÷ 1500) × 100
Period: Calendar Year (Jan-Dec)
Colors:
0-60% Green
60-80% Yellow
80-100%+ Red
SISA/MSA %
Formula: (SISA Hours ÷ Limit) × 100
Period: Fiscal Year (Jul-Jun)
Limits: 960h (SISA) or 1920h (MSA)
Dynamic Title: Automatically changes between "SISA %" and "MSA %"
CalPERS %
Formula: (CalPERS Hours ÷ 1000) × 100
Period: Fiscal Year (Jul-Jun)
Purpose: Monitor eligibility for CalPERS retirement
OT %
Formula: (OT Hours ÷ Total Hours) × 100
Period: Calendar Year (Jan-Dec)
Colors:
0-40% Green
40-60% Yellow
60-100% Red
📈 Information Cards
Total Hours
Total hours worked in the selected calendar year
Calculation: REG_HRS + OT_HRS
Regular Hours
Regular hours worked (without overtime)
Period: Calendar year
Overtime Hours
Total overtime hours worked
Period: Calendar year
Health Insurance Status
Health insurance eligibility
Criteria: 480h in 6 months OR 960h in 12 months
📊 Historical Charts
Hours Trend
Type: Line Chart
Series: REG_HRS, OT_HRS, Total_Hours
Period: Monthly for selected year
Interactivity: Cross-filter with SISA/MSA gauges
Monthly Breakdown
Type: Table
Columns: Month, Year, SISA/MSA, CalPERS, REG_HRS, OT_HRS, Total_Hours
Purpose: Month-by-month breakdown
🎯 Special Features
- Cross-Filter: Clicking on months in the chart updates SISA/MSA gauges
- "Last Year" Logic: When selecting multiple years, shows only the most recent
- SISA→MSA Transition: Gauge detects code change and adjusts title/limit
- Fiscal vs Calendar Year: Metrics automatically respect correct periods